For industrial plant directors and logistics CFOs evaluating automation proposals, adoption decisions rarely hinge on technical novelty. The primary decision gate is strictly quantitative: “How many operating months until the capital deployment achieves full payback (BEP) and generates positive operating cash flow?"
Here is an industrial engineering and financial model formalizing the TCO and ROI dynamics of physical AI robotics deployments.
1. Cumulative Payback & Breakeven Curve Across 2-Shift Operations
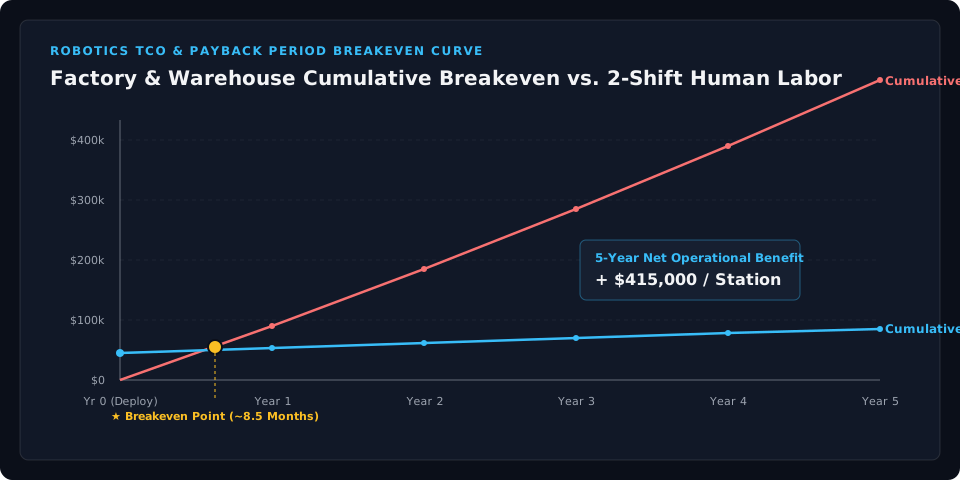
- Cumulative Human Labor (Red Line): Two-shift staffing (two full-time equivalents at $45,000/year base plus 3% annual wage inflation) totals ~$500,000 over five years.
- Cumulative Robot TCO (Sky Blue Line): Initial Year 0 hardware and cell integration of $45,000 plus $8,000 annual recurring maintenance totals ~$85,000 over five years.
- Payback Inflection Point: Breakeven occurs at Month 8.5, after which the station delivers pure recurring operational margin.
2. Mathematical Formalization of Robotics TCO
Industrial robotics Total Cost of Ownership is governed by the following discounted cash flow formulation:
(1) Initial Capital Expenditure (CAPEX)
- : Robot chassis procurement ($25,000 to $45,000 for production humanoids / $20,000 for heavy cobots).
- : End-effector customization (magnetic/vacuum grippers, precision tool changers, sensor gloves).
- : System integration (SI) engineering, linking the robot to existing conveyors, PLCs, and Manufacturing Execution Systems (MES) (typically 30% to 50% of base hardware cost).
- : Optical perimeter curtains, safety LiDAR scanners, and ISO 10218 compliance verification.
(2) Annual Operating Expenses (OPEX)
- : Electricity draw (~1 kWh average load at 5,000 operating hours totals ~$600 to $1,000/year).
- : Scheduled preventative parts replacement (gearbox grease flushes, tendon cable sets, battery pack refresh).
- : Cloud fleet management, Over-the-Air (OTA) telemetry, and MLOps subscription tiers ($2,000 to $3,500/year).
- : Unscheduled line-stop reserve (Mean Time to Repair, MTTR).
3. Payback Period and 5-Year ROI Simulation Across Shift Models
Baseline Assumptions: Robot CAPEX = $45,000; Annual Robot OPEX = $8,000; Base Human Compensation = $45,000/FTE; Annual Wage Escalation = 3%.
| Operational Profile | FTE Workers Displaced | Year 1 Human Wages | Year 1 Robot TCO | Payback Period (BEP) | 5-Year Cumulative Savings | 5-Year Simple ROI (%) |
|---|---|---|---|---|---|---|
| Single-Shift (40h/week) | 1 Worker | $45,000 | $53,000 | ~14.5 Months (1.2 Years) | +$148,000 | 230% |
| Two-Shift (80h/week) | 2 Workers (Day/Night) | $90,000 | $53,000 | ~8.5 Months (0.7 Years) | +$415,000 | 488% |
| Three-Shift (24/7 Continuous) | 3 Workers (Full Uptime) | $135,000 | $53,000 | ~5.5 Months (0.45 Years) | +$680,000 | 780% |
4. Mitigating Hidden Operational Risks
To ensure projected payback metrics materialize in practice, plant managers must account for three structural execution risks:
- Ramp-Up Productivity Drag:
- During the initial 30 to 90 days, handling unstructured components may trigger intermittent station pauses. Conducting extensive virtual commissioning inside Omniverse digital twins prevents unexpected line stoppages.
- Distal End-Effector Wear Rates:
- 20-DoF robotic hands subject cables and elastomeric skin pads to high-cycle fatigue under 24/7 duty cycles. Securing rapid-swap modular replacement gloves prevents costly maintenance delays.
- Human Collaborative Safety Protocols:
- Shared-workspace deployments require certified compliance with ISO/TS 15066 power and force limiting (PFL) thresholds, avoiding worker resistance through structured re-skilling.
Deploying physical AI into high-intensity two-shift and three-shift manufacturing cells offers one of the most reliable capital-payback opportunities in modern industrial engineering.
For infrastructure pipelines that minimize fleet downtime via continuous cloud updates, review our technical guide on Physical AI MLOps and Fleet Telemetry.