Where robotics research was once confined to academic grants and demonstration videos, the commercialization of physical AI is now governed by multi-billion-dollar joint ventures and strategic equity alliances.
To avoid the multi-hundred-million-dollar capital expenditures and tooling risks of physical manufacturing, Big Tech software giants are executing distinct division-of-labor partnerships. Here is an architectural and economic teardown of the four dominant global physical AI alliances.
1. Global Big Tech Robotics Alliance Matrix
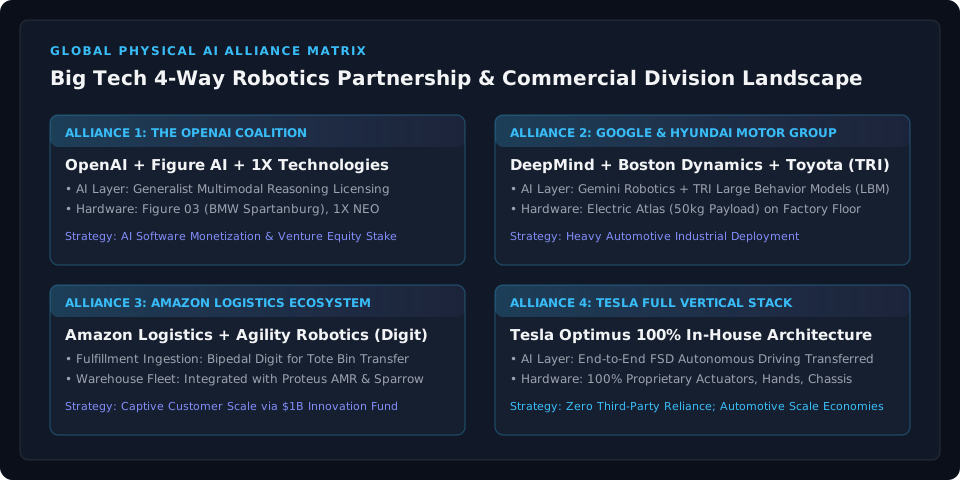
[1. OpenAI Coalition]       ──> Foundation Intelligence Licensing ──> Figure AI (BMW Plant) & 1X NEO (Domestic)
[2. Google–Hyundai Axis]    ──> Gemini Robotics + TRI LBM ──────────> Boston Dynamics Electric Atlas (Auto Plants)
[3. Amazon Ecosystem]       ──> $1B Industrial Innovation Fund ─────> Agility Robotics Digit (Fulfillment Ingestion)
[4. Tesla Vertical Stack]   ──> End-to-End FSD Neural Weights ──────> Optimus Gen3 (Gigafactory In-House Scale)
2. Comparing the Four Strategic Blocs
| Comparison Vector | The OpenAI Coalition (Figure, 1X) | Google DeepMind & Hyundai Axis | Amazon Robotics Ecosystem | Tesla In-House Vertical Model |
|---|---|---|---|---|
| Foundation AI Stack | OpenAI Multimodal APIs + Figure Helix VLA | Google Gemini Robotics + Toyota TRI LBM | AWS Robotics Cloud + Agility OS | Tesla FSD End-to-End Transferred Network |
| Hardware Platform | Figure 03, 1X NEO | Boston Dynamics Electric Atlas | Agility Robotics (Digit) + Proteus AMRs | 100% Proprietary Optimus Gen3 |
| Primary Industrial Target | BMW Spartanburg automotive assembly, domestic tasks | Hyundai Motor Group mega-factories | Amazon fulfillment tote bin conveyance | Gigafactory 4680 battery cell & sub-assembly |
| Commercial Strategy | AI software licensing + OEM unit margins | Captive automotive manufacturing cost reduction | Logistics labor displacement (TCO optimization) | Direct unit sales + Cybercab ecosystem scale |
| Capital Architecture | Microsoft & OpenAI Startup Fund equity backing | Hyundai Motor Group 80% majority stake | $1B Amazon Industrial Innovation Fund backing | Internal Tesla automotive division (Zero outside dilution) |
3. Deep-Dive: Core Strengths and Structural Vulnerabilities
(1) OpenAI + Figure AI: High Valuation vs. API Dependency
Backed by venture capital and Microsoft cloud infrastructure, Figure AI rapidly deployed trial units inside BMW’s Spartanburg facility.
- Strengths: Immediate access to cutting-edge multimodal cognitive models, allowing rapid visual reasoning and conversational task execution.
- Vulnerabilities: Exposure to OpenAI API pricing and architectural shifts. This structural dependency explains why Figure has invested heavily in developing Helix, its proprietary internal VLA architecture.
(2) Google DeepMind + Hyundai + Boston Dynamics: Heavyweight Engineering Moat
The tripartite combination of Hyundai’s manufacturing capital, Boston Dynamics’ all-electric 56-DoF Atlas, and DeepMind’s Gemini Robotics models creates an unmatched industrial powerhouse.
- Strengths: Extraordinary 50 kg payload capacity and immediate access to millions of square feet of active automotive assembly lines for continuous physical data harvesting.
- Vulnerabilities: Boston Dynamics’ historical engineering focus on performance over unit cost, which may prolong the timeline to achieve sub-$30,000 mass-production unit economics.
(3) Amazon + Agility Robotics: Captive Scale Without Retail Friction
Amazon is testing Agility Robotics’ bipedal Digit across fulfillment centers to pick, carry, and place standard plastic totes.
- Strengths: Guaranteed multi-thousand-unit demand across Amazon’s global warehouse footprint without requiring consumer marketing or third-party sales pipelines.
- Vulnerabilities: Digit’s non-anthropomorphic paddle-style end-effectors limit its operational envelope strictly to box handling, preventing deployment into precision assembly or service domains.
(4) Tesla: Uncompromising In-House Vertical Integration
Tesla refuses third-party component sourcing, engineering its frameless BLDC motors, cycloidal reducers, 22-DoF hands, and edge silicon internally.
- Strengths: Direct leverage of automotive die-casting, high-volume supply chains, and battery manufacturing, making Tesla the only player with a clear technical roadmap to sub-$20,000 unit costs.
- Vulnerabilities: Resource competition with Cybertruck, FSD, and Cybercab programs, which risks extending hardware validation timelines under aggressive production quotas.
4. Strategic Takeaways: The Real Metric of Commercial Victory
The ultimate winners in physical AI will not be crowned by viral agility videos on social media, but by annual mean time between failures (MTBF) exceeding 8,000 operating hours on factory floors, delivering verified payback periods under 24 months.
To review how subsystem hardware pricing determines unit economics across these platforms, explore our Humanoid BOM Cost Teardown & Value Chain Analysis.